
 16th
September 2025 (Tuesday)
16th
September 2025 (Tuesday)
 11:00 AM
Mountain Time (US and Canada)
11:00 AM
Mountain Time (US and Canada)
A CMMS dashboard that actually talks back, spot issues early and act fast.
Drive portfolio-wide alignment with real-time CMMS dashboards that surface insights and accelerate decisions across the UAE.
Why reporting in most CMMS platforms fails decision-makers
Manual exports lead to static reports—decisions are based on lagging data, not what’s happening now.
Work order, asset, and vendor data stay siloed, limiting O&M teams’ visibility across sites.
Reporting outside the CMMS keeps teams from tracing issues back to the source.
Teams spend hours pulling reports from tools to meet audits and logbook needs.
CFS transformed facility ops and gained total visibility with Facilio faster than ever, in just 4 months
Other CMMS dashboards show you what’s broken; But Facilio shows you what to fix, when, and why.
Telemetry and portfolio data analysis made easy
 Spot issues before they escalate Analyze high-volume telemetry and ops data across client sites—identify risks, delays, or bottlenecks early.
- Drill down from trends to task-level action Navigate from a KPI drop to the exact work order or asset in seconds. No toggling between tools.
- Keep clients informed with scheduled reporting Automate reports and enable dashboard screen casting to share performance updates without manual effort.
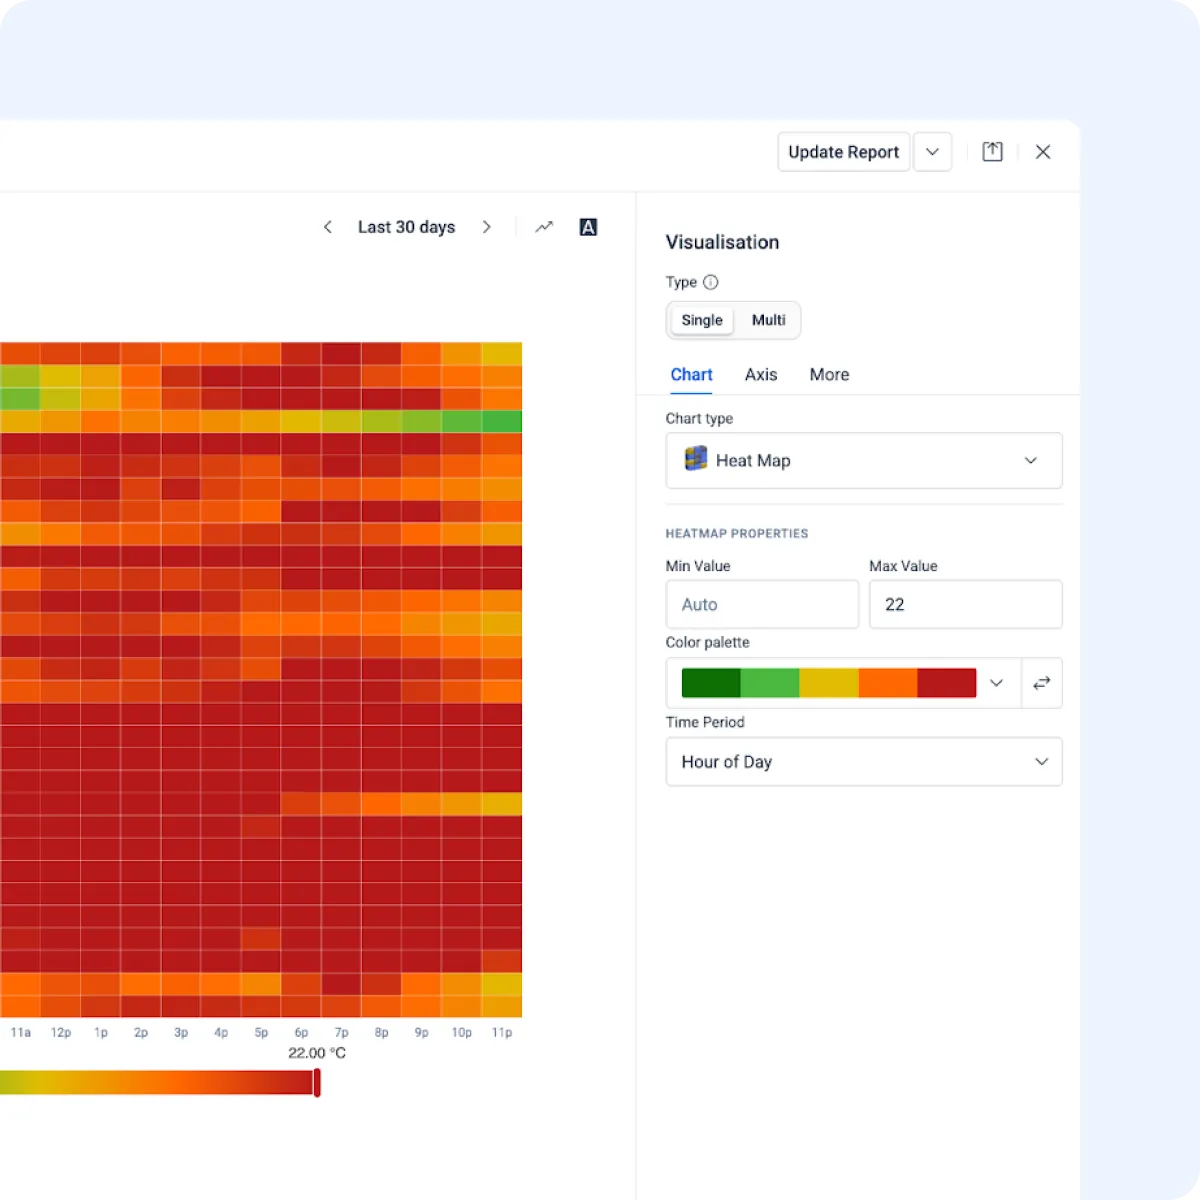
Make your data work visually
- Highlight what matters at a glance Use thresholds, colors, and patterns to surface SLA breaches, asset downtime, and contractor delays instantly.
- Visualize performance across assets and teams Leverage dynamic charts like heat/tree maps to monitor job status, backlogs, or contractor productivity in real time.
- Filter by contract, zone, or priority Apply filters at every level to tailor dashboards by service contract, building type, or criticality.
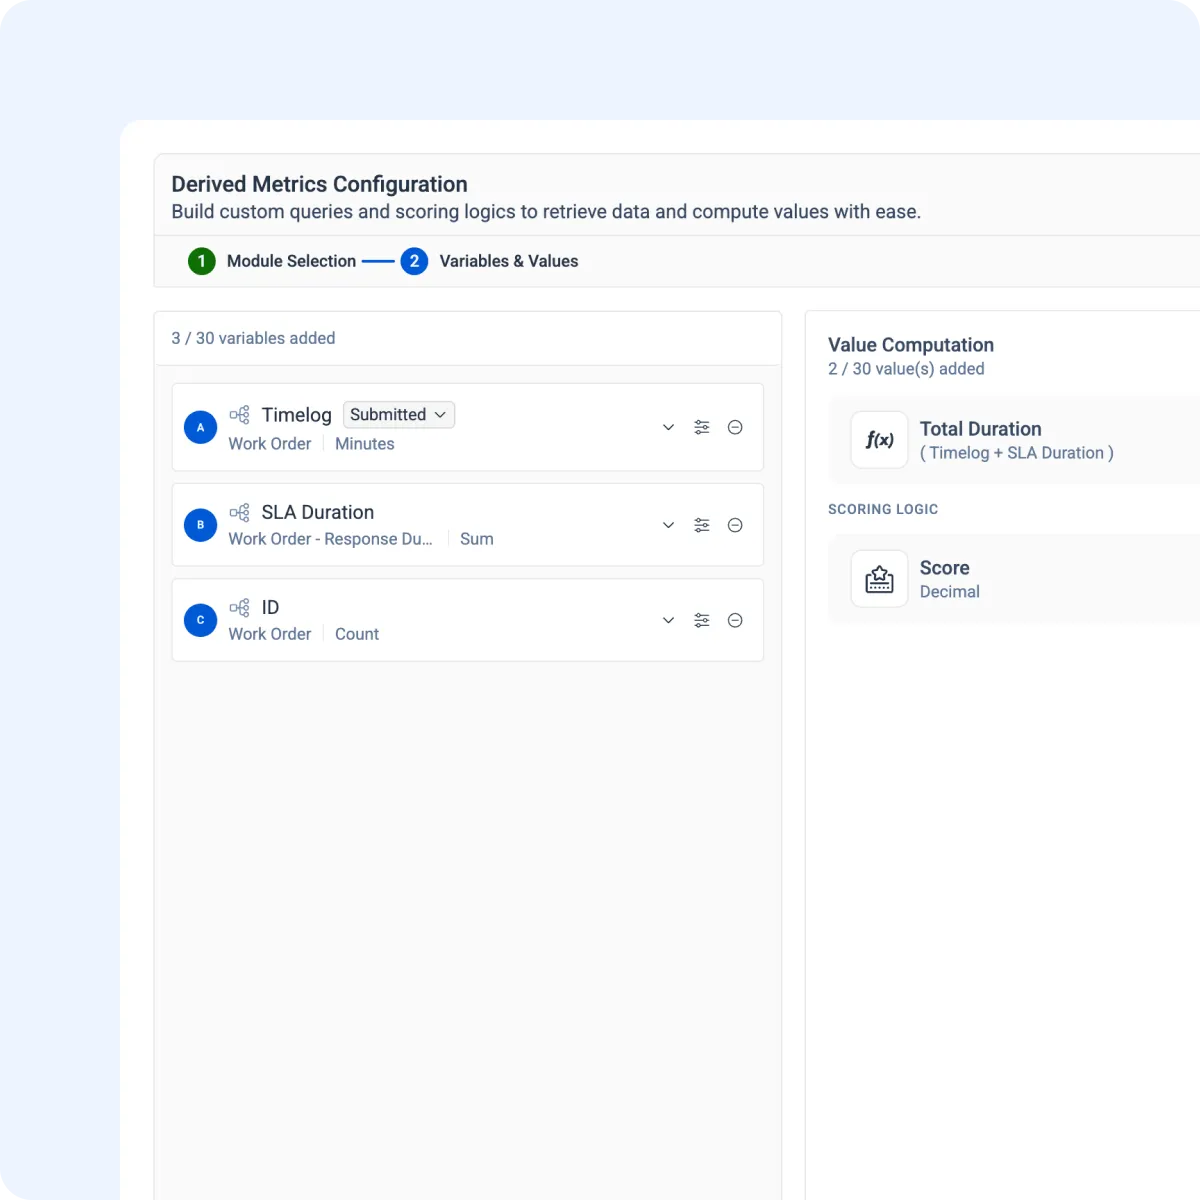
Create and track custom KPIs with ease
- Build KPIs tailored to your contracts Create composite scores, assign weights, and automate calculations for SLA tracking, vendor performance, etc.
- Score what your clients care about Define scoring rules and weights to track vendor, maintenance, and asset performance in one view.
- Combine modules for smarter metrics Combine work orders, audits, and vendor data using expressions to build precise, contextual metrics.
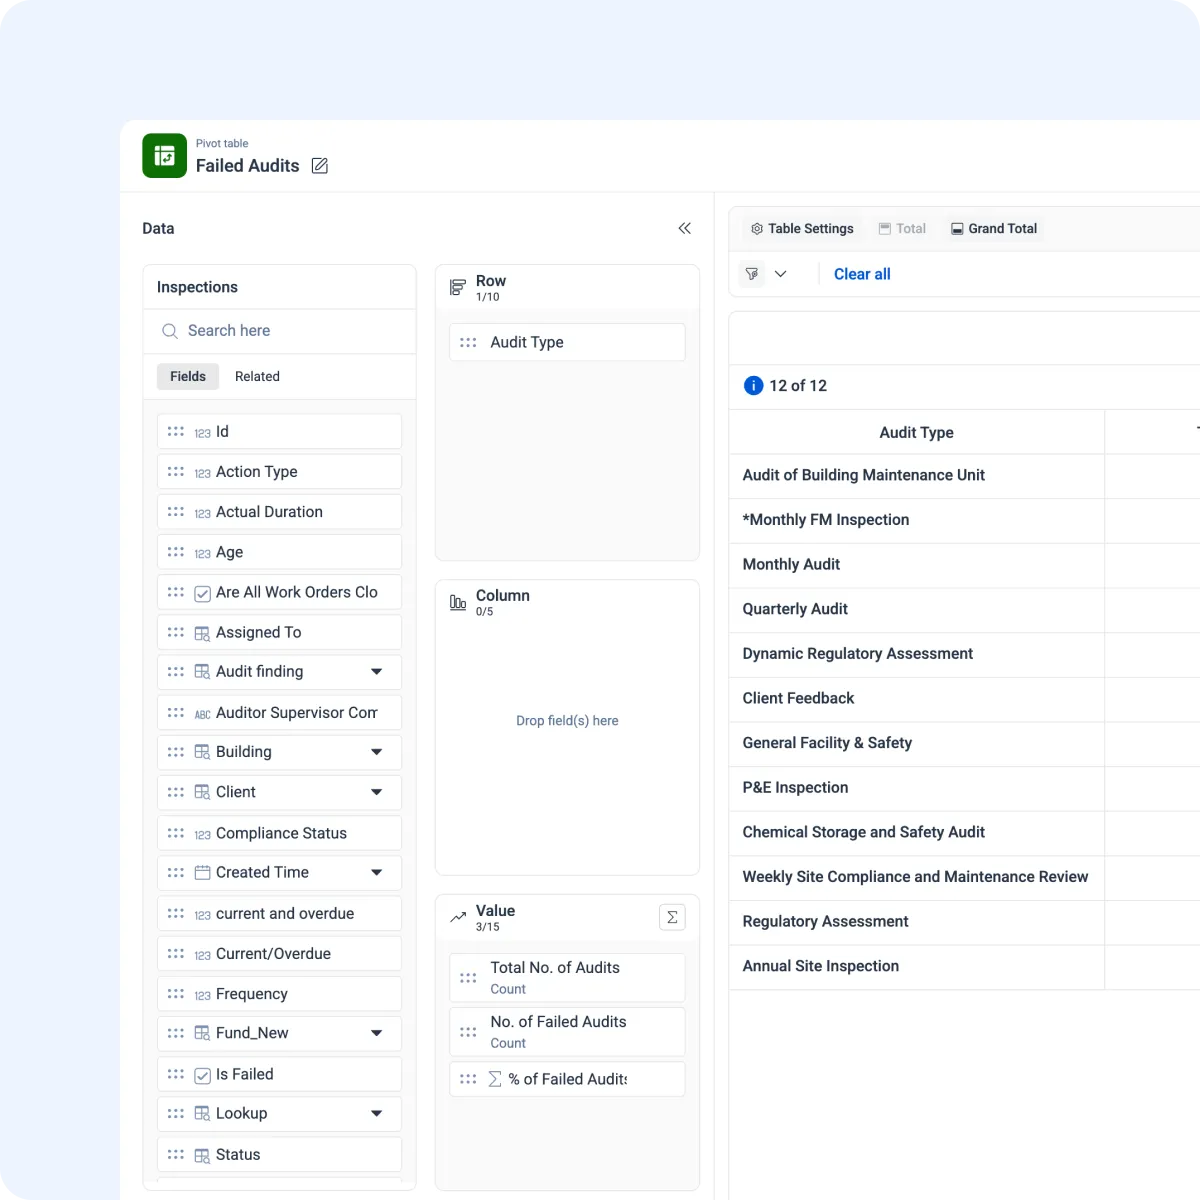
Unlock deeper insights with advanced pivot analysis
- Structure raw data for better decisions Organize telemetry or ops data into rows and columns using tree or table views for clarity.
- Highlight trends with powerful formatting Use color coding and cell-level formatting to process large datasets and surface key insights quickly.
- Schedule or access real-time views Run pivots live or on a set schedule to stay on top of compliance, performance, and backlog across your portfolio.
Design powerful dashboards with drag-and-drop widgets
- Choose widgets that match your ops Create dashboards in minutes with an intuitive builder and widget control—no technical skills needed.
- Control who sees what, and when Set dashboard permissions by account manager, zone lead, or client to ensure the right data lands with the right team.
- Apply filters that sync across widgets One filter updates the entire dashboard—drill down by building, technician, or asset category in seconds.
Traditional Dashboard vs. Facilio’s Connected CMMS Dashboard
What’s holding you back and what’s possible when you switch
| Before Facilio | After Facilio |
|---|---|


“As soon as we migrated to Facilio, we saw a steep drop in customer escalations. Staff efficiency increased and we now have a happier workforce.”


Unlock real-time insights and drive smarter decisions with Facilio.